Storage - Walkthroughs
5 Tips To Speed Up Linux Software Raid Rebuilding And Re-syncing
It is no secret that I am a pretty big fan of excellent Linux Software RAID. Creating, assembling and rebuilding small array is fine. But, things started to get nasty when you try to rebuild or re-sync large size array. You may get frustrated when you see it is going to take 22 hours to rebuild the array. You can always increase the speed of Linux Software RAID 0/1/5/6 reconstruction using the following five tips.
Why speed up Linux software RAID rebuilding and re-syncing?
Recently, I build a small NAS server running Linux for one my client with 5 x 2TB disks in RAID 6 configuration for all in one backup server for Linux, Mac OS X, and Windows XP/Vista/7/10 client computers. Next, I type the command cat /proc/mdstat and it reported that md0 is active and recovery is in progress. The recovery speed was around 4000K/sec and will complete in approximately in 22 hours. I wanted to finish this early.
A note about lazy initialization and ext4 file system
When creating an ext4 file system, the Linux kernel uses lazy initialization. This feature allows the faster creatation of a file system. A process called “ext4lazyinit” runs in the background to create rest of all inode tables. As a result, your RAID rebuild is going to operate at minimal speed. This only affects if you have just created an ext4 filesystem. There is an option to enable or disable this feature while running mkfs.ext4 command:
- If enabled and the uninit_bg feature is enabled, the inode table will not be fully initialized by mke2fs. This speeds up filesystem initialization noticeably, but it requires the kernel to finish initializing the filesystem in the background when the filesystem is first mounted. If the option value is omitted, it defaults to 1 to enable lazy inode table zeroing.
lazy_itable_init[= <0 to disable, 1 to enable>]- If enabled, the journal inode will not be fully zeroed out by mke2fs. This speeds up filesystem initialization noticeably, but carries some small risk if the system crashes before the journal has been overwritten entirely one time. If the option value is omitted, it defaults to 1 to enable lazy journal inode zeroing.
lazy_journal_init[= <0 to disable, 1 to enable>]Tip #1: /proc/sys/dev/raid/{speed_limit_max,speed_limit_min} kernel variables
The /proc/sys/dev/raid/speed_limit_min is config file that reflects the current “goal” rebuild speed for times when non-rebuild activity is current on an array. The speed is in Kibibytes per second (1 kibibyte = 210 bytes = 1024 bytes), and is a per-device rate, not a per-array rate . The default is 1000.
The /proc/sys/dev/raid/speed_limit_max is config file that reflects the current “goal” rebuild speed for times when no non-rebuild activity is current on an array. The default is 100,000.
To see current limits, enter:
sysctl dev.raid.speed_limit_min
sysctl dev.raid.speed_limit_max
Sample outputs:
dev.raid.speed_limit_min = 10000
dev.raid.speed_limit_max = 20000
NOTE: The following hacks are used for recovering Linux software raid, and to increase the speed of RAID rebuilds. Options are good for tweaking rebuilt process and may increase overall system load, high cpu and memory usage.
To increase speed, enter:
echo value > /proc/sys/dev/raid/speed_limit_minOR
sysctl -w dev.raid.speed_limit_min=valueIn this example, set it to 50000 K/Sec, enter:
echo 50000 > /proc/sys/dev/raid/speed_limit_minOR
sysctl -w dev.raid.speed_limit_min=50000If you want to override the defaults you could add these two lines to /etc/sysctl.conf:
#################NOTE ################
##  You are limited by CPU and memory too #
###########################################
dev.raid.speed_limit_min = 50000
## good for 4-5 disks based array ##
dev.raid.speed_limit_max = 2000000
## good for large 6-12 disks based array ###
dev.raid.speed_limit_max = 5000000
Tip #2: Set read-ahead option
Set readahead (in 512-byte sectors) per raid device. The syntax is:
blockdev --setra 65536 /dev/mdX
## Set read-ahead to 32 MiB ##
blockdev --setra 65536 /dev/md0
blockdev --setra 65536 /dev/md1
Tip #3: Set stripe-cache_size for RAID5 or RAID 6
This is only available on RAID5 and RAID6 and boost sync performance by 3-6 times. It records the size (in pages per device) of the stripe cache which is used for synchronising all write operations to the array and all read operations if the array is degraded. The default is 256. Valid values are 17 to 32768. Increasing this number can increase performance in some situations, at some cost in system memory. Note, setting this value too high can result in an “out of memory” condition for the system. Use the following formula:
memory_consumed = system_page_size * nr_disks * stripe_cache_sizeTo set stripe_cache_size to 16 MiB for /dev/md0, type:
echo 16384 > /sys/block/md0/md/stripe_cache_sizeTo set stripe_cache_size to 32 MiB for /dev/md3, type:
echo 32768 > /sys/block/md3/md/stripe_cache_sizeTip #4: Disable NCQ on all disks
The following will disable NCQ on /dev/sda,/dev/sdb,..,/dev/sde using bash for loop
## sample for loop ##
for i in sd[abcde]
do
  echo 1 > /sys/block/$i/device/queue_depth
done
Tip #5: Bitmap Option
Bitmaps optimize rebuild time after a crash, or after removing and re-adding a device. Turn it on by typing the following command:
mdadm --grow --bitmap=internal /dev/md0Once array rebuild or fully synced, disable bitmaps:
mdadm --grow --bitmap=none /dev/md0Results
My speed went from 4k to 51k:
cat /proc/mdstatSample outputs:
Personalities : [linear] [raid0] [raid1] [raid10] [raid6] [raid5] [raid4] [multipath]
md5 : active raid1 sde2[2](S) sdd2[3](S) sdc2[4](S) sdb2[1] sda2[0]
      530048 blocks [2/2] [UU]

md0 : active raid6 sde3[4] sdd3[3] sdc3[2] sdb3[1] sda3[0]
      5855836800 blocks level 6, 64k chunk, algorithm 2 [5/5] [UUUUU]
      [============>........]  resync = 61.7% (1205475036/1951945600) finish=242.9min speed=51204K/sec
Monitoring raid rebuilding/recovery process like a pro
You cat /proc/mdstat file. This read-only file contains information about the status of currently running array and shows rebuilding speed:
cat /proc/mdstatAlternatively use the watch command to display /proc/mdstat output on screen repeatedly, type:
watch -n1 cat /proc/mdstatSample outputs: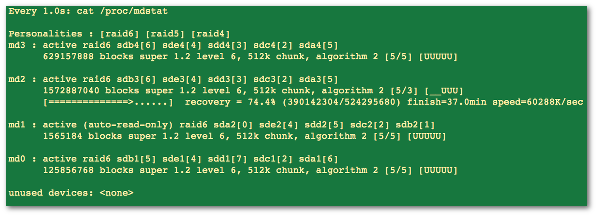
Fig.01: Performance optimization for Linux raid6 for /dev/md2
The following command provide details about /dev/md2 raid arrray including status and health report:
mdadm --detail /dev/md2Sample outputs: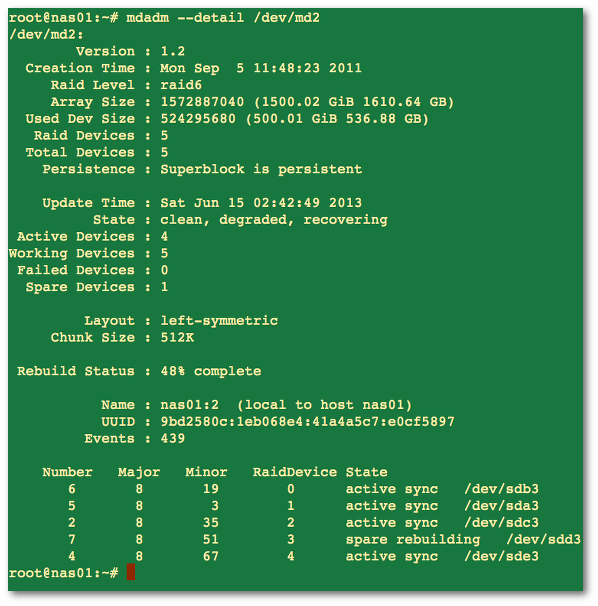
Fig.02: Finding out information about md2 raid array
You can filter out info using the grep command or egrep command as follows:
mdadm --detail /dev/md3 | grep 'info-you-want'Another option is to see what is actually happening by typing the following iostat command to see disk utilization:
watch iostat -k 1 2
watch -n1 iostat -k 1 2
Sample outputs: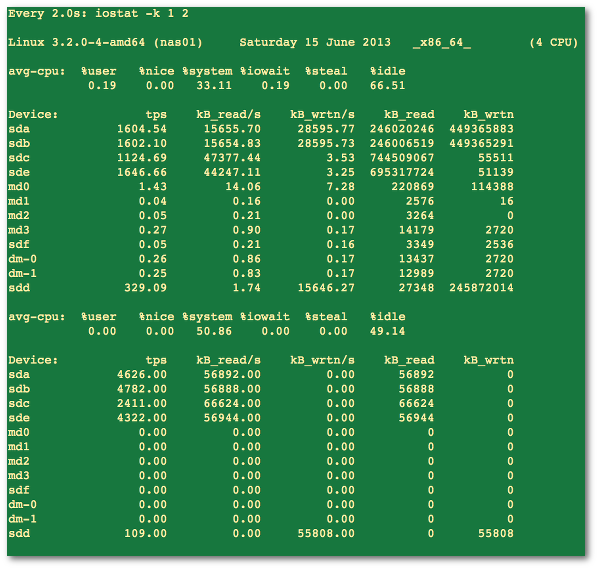
Fig.03: Find out CPU statistics and input/output statistics for devices and partitions
Feel free to use the df command or du command to get info about the disk space usage on Linux. For example:
df -hT /raid1
du -csh /raid1
Conclusion
We learned how to optimize speed for Linux software RAID devices.
See man pages – mdadm(8) using the man command:
man 4 md
man 8 mdadm
man 5 proc
Also look into /etc/cron.d/mdadm and /usr/share/mdadm/checkarray on Debian/Ubuntu Linux
Synology
Synology Discord Webhooks
- Add the discord server and webhook, using Http Method "POST"
- HTTP Request content header --> Content-Type = "application/json"
- HTTP Request body --> set parameter="content" and value="-"
- Parameter Type --> set "Content-Type" = "Other" and "content" = "Message Content"
Synology Vendor Lock Hack
- Edit the file:
/etc.defaults/synoinfo.conf- Then find the option support_disk_compatibility and change it from yes to no.
support_disk_compatibility="no"- Then reboot.
TrueNAS
Checking ASHIFT On Existing Pools
So I have an existing pool that was created several years ago on an old build of FreeNAS, and I wanted to check and see if the ashift was set correctly for 4K, meaning I want an ashift=12 (2^12=4096). What does a quick Google tell me to do?
[root@server] ~# zpool get all | grep ashift
[root@server] ~#
Huh… nothing. That’s odd.
[root@server] ~# zpool get all
NAME          PROPERTY                       VALUE                                       SOURCE
Array1        size                           2.72T                                       -
Array1        capacity                       13%                                         -
Array1        altroot                        /mnt                                        local
Array1        health                         ONLINE                                      -
Array1        guid                           4640375899101559431                         default
Array1        version                        -                                           default
Array1        bootfs                         -                                           default
Array1        delegation                     on                                          default
Array1        autoreplace                    off                                         default
Array1        cachefile                      /data/zfs/zpool.cache                       local
Array1        failmode                       continue                                    local
Array1        listsnapshots                  off                                         default
Array1        autoexpand                     on                                          local
Array1        dedupditto                     0                                           default
Array1        dedupratio                     1.00x                                       -
Array1        free                           2.36T                                       -
Array1        allocated                      364G                                        -
Array1        readonly                       off                                         -
Array1        comment                        -                                           default
Array1        expandsize                     -                                           -
Array1        freeing                        0                                           default
Array1        fragmentation                  12%                                         -
Array1        leaked                         0                                           default
Array1        feature@async_destroy          enabled                                     local
Array1        feature@empty_bpobj            active                                      local
Array1        feature@lz4_compress           active                                      local
Array1        feature@multi_vdev_crash_dump  enabled                                     local
Array1        feature@spacemap_histogram     active                                      local
Array1        feature@enabled_txg            active                                      local
Array1        feature@hole_birth             active                                      local
Array1        feature@extensible_dataset     enabled                                     local
Array1        feature@embedded_data          disabled                                    local
Array1        feature@bookmarks              enabled                                     local
Array1        feature@filesystem_limits      disabled                                    local
Array1        feature@large_blocks           disabled                                    local
freenas-boot  size                           14.2G                                       -
freenas-boot  capacity                       5%                                          -
freenas-boot  altroot                        -                                           default
freenas-boot  health                         ONLINE                                      -
freenas-boot  guid                           11011409209729808822                        default
freenas-boot  version                        -                                           default
freenas-boot  bootfs                         freenas-boot/ROOT/9.10-STABLE-201604261518  local
freenas-boot  delegation                     on                                          default
freenas-boot  autoreplace                    off                                         default
freenas-boot  cachefile                      -                                           default
freenas-boot  failmode                       wait                                        default
freenas-boot  listsnapshots                  off                                         default
freenas-boot  autoexpand                     off                                         default
freenas-boot  dedupditto                     0                                           default
freenas-boot  dedupratio                     1.00x                                       -
freenas-boot  free                           13.5G                                       -
freenas-boot  allocated                      773M                                        -
freenas-boot  readonly                       off                                         -
freenas-boot  comment                        -                                           default
freenas-boot  expandsize                     -                                           -
freenas-boot  freeing                        0                                           default
freenas-boot  fragmentation                  -                                           -
freenas-boot  leaked                         0                                           default
freenas-boot  feature@async_destroy          enabled                                     local
freenas-boot  feature@empty_bpobj            active                                      local
freenas-boot  feature@lz4_compress           active                                      local
freenas-boot  feature@multi_vdev_crash_dump  disabled                                    local
freenas-boot  feature@spacemap_histogram     disabled                                    local
freenas-boot  feature@enabled_txg            disabled                                    local
freenas-boot  feature@hole_birth             disabled                                    local
freenas-boot  feature@extensible_dataset     disabled                                    local
freenas-boot  feature@embedded_data          disabled                                    local
freenas-boot  feature@bookmarks              disabled                                    local
freenas-boot  feature@filesystem_limits      disabled                                    local
freenas-boot  feature@large_blocks           disabled                                    local
Looking at just the zpool get all output, looks like the ashift attribute is missing. I’m guessing that the ashift attribute wasn’t specified upon pool creation, leaving it up to the drive to report whether it is a 4K drive or not. Another round of Google reveals the zdb -C command. Let’s try that.
[root@server] ~# zdb -C | grep ashift
            ashift: 9
Huh. ashift=9 means 512… and that’s no good. But wait…
[root@server] ~# zdb -C
freenas-boot:
    version: 5000
    name: 'freenas-boot'
    state: 0
    txg: 95367
    pool_guid: 11011409209729808822
    hostid: 2882373074
    hostname: ''
    vdev_children: 1
    vdev_tree:
        type: 'root'
        id: 0
        guid: 11011409209729808822
        create_txg: 4
        children[0]:
            type: 'disk'
            id: 0
            guid: 14099280634272200775
            path: '/dev/da0p2'
            whole_disk: 1
            metaslab_array: 30
            metaslab_shift: 27
            ashift: 9
            asize: 15370551296
            is_log: 0
            create_txg: 4
    features_for_read:
zdb is only listing the USB boot drive. Back to Google and we get…
[root@server] ~# zdb -U /data/zfs/zpool.cache
Array1:
    version: 5000
    name: 'Array1'
    state: 0
    txg: 8520213
    pool_guid: 4640375899101559431
    hostid: 2882373074
    hostname: 'server.workgroup'
    vdev_children: 1
    vdev_tree:
        type: 'root'
        id: 0
        guid: 4640375899101559431
        children[0]:
            type: 'raidz'
            id: 0
            guid: 7207720561268687283
            nparity: 1
            metaslab_array: 35
            metaslab_shift: 34
            ashift: 12
            asize: 2994157387776
            is_log: 0
            create_txg: 4
            children[0]:
                type: 'disk'
                id: 0
                guid: 2714791811722168437
                path: '/dev/gptid/cca60fe6-5031-11e4-9120-001bb9ed2d38'
                whole_disk: 1
                DTL: 204
                create_txg: 4
            children[1]:
                type: 'disk'
                id: 1
                guid: 6091442355483197824
                path: '/dev/gptid/cd472cc3-5031-11e4-9120-001bb9ed2d38'
                whole_disk: 1
                DTL: 163
                create_txg: 4
            children[2]:
                type: 'disk'
                id: 2
                guid: 1150763296991461133
                path: '/dev/gptid/21338e8c-25ea-11e6-a898-3cd92b0298a8'
                whole_disk: 1
                DTL: 377
                create_txg: 4
    features_for_read:
        com.delphix:hole_birth
There we go. Now let’s that down.
[root@server] ~# zdb -U /data/zfs/zpool.cache | grep ashift
            ashift: 12
And we have our answer.
Migrating the iocage Dataset to Another Pool
First, you migrate your pools like this :
iocage stop ALL
zfs unmount -f tank/iocage
zfs snapshot -r tank/iocage@migration
zfs send -R tank/iocage@migration | zfs receive -v dozer/iocage
iocage clean -a
zfs destroy -f tank/iocage
iocage activate dozer
zfs destroy -r dozer/iocage@migration
Here, you should use your own pool names.
The old pool is named tank, the new one dozer
Then, you could need to edit your jail mount points.
To do this, you have to :
1. Set nano as your editor (optional if you know how to search and replace with vi)
EDITOR=/usr/local/bin/nano; export EDITORThen edit the fstab of your jails
iocage fstab -e yourjailThen do search and replace all with nano, searching with your old mountpoint /mnt/tank/iocage with /mnt/dozer/iocage
Tested on 11.2U1
Querying ZFS Storage Pool Status
The zpool list command provides several ways to request information regarding pool status. The information available generally falls into three categories: basic usage information, I/O statistics, and health status. All three types of storage pool information are covered in this section.
- Displaying Information About ZFS Storage Pools
- Viewing I/O Statistics for ZFS Storage Pools
- Determining the Health Status of ZFS Storage Pools
Displaying Information About ZFS Storage Pools
You can use the zpool list command to display basic information about pools.
Listing Information About All Storage Pools or a Specific Pool
With no arguments, the zpool list command displays the following information for all pools on the system:
# zpool list
NAME                    SIZE    ALLOC   FREE    CAP  HEALTH     ALTROOT
tank                   80.0G   22.3G   47.7G    28%  ONLINE     -
dozer                   1.2T    384G    816G    32%  ONLINE     -
This command output displays the following information:
NAME
The name of the pool.
SIZE
The total size of the pool, equal to the sum of the sizes of all top-level virtual devices.
ALLOC
The amount of physical space allocated to all datasets and internal metadata. Note that this amount differs from the amount of disk space as reported at the file system level.
For more information about determining available file system space, see ZFS Disk Space Accounting.
FREE
The amount of unallocated space in the pool.
CAP (CAPACITY)
The amount of disk space used, expressed as a percentage of the total disk space.
HEALTH
The current health status of the pool.
For more information about pool health, see Determining the Health Status of ZFS Storage Pools.
ALTROOT
The alternate root of the pool, if one exists.
For more information about alternate root pools, see Using ZFS Alternate Root Pools.
You can also gather statistics for a specific pool by specifying the pool name. For example:
# zpool list tank
NAME                    SIZE    ALLOC   FREE    CAP   HEALTH     ALTROOT
tank                   80.0G    22.3G   47.7G    28%  ONLINE     -
Listing Specific Storage Pool Statistics
Specific statistics can be requested by using the -o option. This option provides custom reports or a quick way to list pertinent information. For example, to list only the name and size of each pool, you use the following syntax:
# zpool list -o name,size
NAME                    SIZE
tank                   80.0G
dozer                   1.2T
The column names correspond to the properties that are listed in Listing Information About All Storage Pools or a Specific Pool.
Scripting ZFS Storage Pool Output
The default output for the zpool list command is designed for readability and is not easy to use as part of a shell script. To aid programmatic uses of the command, the -H option can be used to suppress the column headings and separate fields by tabs, rather than by spaces. For example, to request a list of all pool names on the system, you would use the following syntax:
# zpool list -Ho name
tank
dozer
Here is another example:
# zpool list -H -o name,size
tank   80.0G
dozer  1.2T
Displaying ZFS Storage Pool Command History
ZFS automatically logs successful zfs and zpool commands that modify pool state information. This information can be displayed by using the zpool history command.
For example, the following syntax displays the command output for the root pool:
# zpool history
History for 'rpool':
2010-05-11.10:18:54 zpool create -f -o failmode=continue -R /a -m legacy -o
cachefile=/tmp/root/etc/zfs/zpool.cache rpool mirror c1t0d0s0 c1t1d0s0
2010-05-11.10:18:55 zfs set canmount=noauto rpool
2010-05-11.10:18:55 zfs set mountpoint=/rpool rpool
2010-05-11.10:18:56 zfs create -o mountpoint=legacy rpool/ROOT
2010-05-11.10:18:57 zfs create -b 8192 -V 2048m rpool/swap
2010-05-11.10:18:58 zfs create -b 131072 -V 1536m rpool/dump
2010-05-11.10:19:01 zfs create -o canmount=noauto rpool/ROOT/zfsBE
2010-05-11.10:19:02 zpool set bootfs=rpool/ROOT/zfsBE rpool
2010-05-11.10:19:02 zfs set mountpoint=/ rpool/ROOT/zfsBE
2010-05-11.10:19:03 zfs set canmount=on rpool
2010-05-11.10:19:04 zfs create -o mountpoint=/export rpool/export
2010-05-11.10:19:05 zfs create rpool/export/home
2010-05-11.11:11:10 zpool set bootfs=rpool rpool
2010-05-11.11:11:10 zpool set bootfs=rpool/ROOT/zfsBE rpool
You can use similar output on your system to identify the actual ZFS commands that were executed to troubleshoot an error condition.
The features of the history log are as follows:
-
The log cannot be disabled.
-
The log is saved persistently on disk, which means that the log is saved across system reboots.
-
The log is implemented as a ring buffer. The minimum size is 128 KB. The maximum size is 32 MB.
-
For smaller pools, the maximum size is capped at 1 percent of the pool size, where the size is determined at pool creation time.
-
The log requires no administration, which means that tuning the size of the log or changing the location of the log is unnecessary.
To identify the command history of a specific storage pool, use syntax similar to the following:
# zpool history tank
History for 'tank':
2010-05-13.14:13:15 zpool create tank mirror c1t2d0 c1t3d0
2010-05-13.14:21:19 zfs create tank/snaps
2010-05-14.08:10:29 zfs create tank/ws01
2010-05-14.08:10:54 zfs snapshot tank/ws01@now
2010-05-14.08:11:05 zfs clone tank/ws01@now tank/ws01bugfix
Use the -l option to display a long format that includes the user name, the host name, and the zone in which the operation was performed. For example:
# zpool history -l tank
History for 'tank':
2010-05-13.14:13:15 zpool create tank mirror c1t2d0 c1t3d0 [user root on neo]
2010-05-13.14:21:19 zfs create tank/snaps [user root on neo]
2010-05-14.08:10:29 zfs create tank/ws01 [user root on neo]
2010-05-14.08:10:54 zfs snapshot tank/ws01@now [user root on neo]
2010-05-14.08:11:05 zfs clone tank/ws01@now tank/ws01bugfix [user root on neo]
Use the -i option to display internal event information that can be used for diagnostic purposes. For example:
# zpool history -i tank
2010-05-13.14:13:15 zpool create -f tank mirror c1t2d0 c1t23d0
2010-05-13.14:13:45 [internal pool create txg:6] pool spa 19; zfs spa 19; zpl 4;...
2010-05-13.14:21:19 zfs create tank/snaps
2010-05-13.14:22:02 [internal replay_inc_sync txg:20451] dataset = 41
2010-05-13.14:25:25 [internal snapshot txg:20480] dataset = 52
2010-05-13.14:25:25 [internal destroy_begin_sync txg:20481] dataset = 41
2010-05-13.14:25:26 [internal destroy txg:20488] dataset = 41
2010-05-13.14:25:26 [internal reservation set txg:20488] 0 dataset = 0
2010-05-14.08:10:29 zfs create tank/ws01
2010-05-14.08:10:54 [internal snapshot txg:53992] dataset = 42
2010-05-14.08:10:54 zfs snapshot tank/ws01@now
2010-05-14.08:11:04 [internal create txg:53994] dataset = 58
2010-05-14.08:11:05 zfs clone tank/ws01@now tank/ws01bugfix
Viewing I/O Statistics for ZFS Storage Pools
To request I/O statistics for a pool or specific virtual devices, use the zpool iostat command. Similar to the iostat command, this command can display a static snapshot of all I/O activity, as well as updated statistics for every specified interval. The following statistics are reported:
alloc capacity
The amount of data currently stored in the pool or device. This amount differs from the amount of disk space available to actual file systems by a small margin due to internal implementation details.
For more information about the differences between pool space and dataset space, see ZFS Disk Space Accounting.
free capacity
The amount of disk space available in the pool or device. As with the used statistic, this amount differs from the amount of disk space available to datasets by a small margin.
read operations
The number of read I/O operations sent to the pool or device, including metadata requests.
write operations
The number of write I/O operations sent to the pool or device.
read bandwidth
The bandwidth of all read operations (including metadata), expressed as units per second.
write bandwidth
The bandwidth of all write operations, expressed as units per second.
Listing Pool-Wide I/O Statistics
With no options, the zpool iostat command displays the accumulated statistics since boot for all pools on the system. For example:
# zpool iostat
               capacity     operations    bandwidth
pool        alloc   free   read  write   read  write
----------  -----  -----  -----  -----  -----  -----
rpool       6.05G  61.9G      0      0    786    107
tank        31.3G  36.7G      4      1   296K  86.1K
----------  -----  -----  -----  -----  -----  -----
Because these statistics are cumulative since boot, bandwidth might appear low if the pool is relatively idle. You can request a more accurate view of current bandwidth usage by specifying an interval. For example:
# zpool iostat tank 2
               capacity     operations    bandwidth
pool        alloc   free   read  write   read  write
----------  -----  -----  -----  -----  -----  -----
tank        18.5G  49.5G      0    187      0  23.3M
tank        18.5G  49.5G      0    464      0  57.7M
tank        18.5G  49.5G      0    457      0  56.6M
tank        18.8G  49.2G      0    435      0  51.3M
In this example, the command displays usage statistics for the pool tank every two seconds until you type Control-C. Alternately, you can specify an additional count argument, which causes the command to terminate after the specified number of iterations. For example, zpool iostat 2 3 would print a summary every two seconds for three iterations, for a total of six seconds. If there is only a single pool, then the statistics are displayed on consecutive lines. If more than one pool exists, then an additional dashed line delineates each iteration to provide visual separation.
Listing Virtual Device I/O Statistics
In addition to pool-wide I/O statistics, the zpool iostat command can display I/O statistics for virtual devices. This command can be used to identify abnormally slow devices or to observe the distribution of I/O generated by ZFS. To request the complete virtual device layout as well as all I/O statistics, use the zpool iostat -v command. For example:
# zpool iostat -v
               capacity     operations    bandwidth
pool        alloc   free   read  write   read  write
----------  -----  -----  -----  -----  -----  -----
rpool       6.05G  61.9G      0      0    785    107
  mirror    6.05G  61.9G      0      0    785    107
    c1t0d0s0    -      -      0      0    578    109
    c1t1d0s0    -      -      0      0    595    109
----------  -----  -----  -----  -----  -----  -----
tank        36.5G  31.5G      4      1   295K   146K
  mirror    36.5G  31.5G    126     45  8.13M  4.01M
    c1t2d0      -      -      0      3   100K   386K
    c1t3d0      -      -      0      3   104K   386K
----------  -----  -----  -----  -----  -----  -----
Note two important points when viewing I/O statistics for virtual devices:
-
First, disk space usage statistics are only available for top-level virtual devices. The way in which disk space is allocated among mirror and RAID-Z virtual devices is particular to the implementation and not easily expressed as a single number.
-
Second, the numbers might not add up exactly as you would expect them to. In particular, operations across RAID-Z and mirrored devices will not be exactly equal. This difference is particularly noticeable immediately after a pool is created, as a significant amount of I/O is done directly to the disks as part of pool creation, which is not accounted for at the mirror level. Over time, these numbers gradually equalize. However, broken, unresponsive, or offline devices can affect this symmetry as well.
You can use the same set of options (interval and count) when examining virtual device statistics.
Determining the Health Status of ZFS Storage Pools
ZFS provides an integrated method of examining pool and device health. The health of a pool is determined from the state of all its devices. This state information is displayed by using the zpool status command. In addition, potential pool and device failures are reported by fmd, displayed on the system console, and logged in the /var/adm/messages file.
This section describes how to determine pool and device health. This chapter does not document how to repair or recover from unhealthy pools. For more information about troubleshooting and data recovery, see Chapter 11, Oracle Solaris ZFS Troubleshooting and Pool Recovery.
Each device can fall into one of the following states:
ONLINE
The device or virtual device is in normal working order. Although some transient errors might still occur, the device is otherwise in working order.
DEGRADED
The virtual device has experienced a failure but can still function. This state is most common when a mirror or RAID-Z device has lost one or more constituent devices. The fault tolerance of the pool might be compromised, as a subsequent fault in another device might be unrecoverable.
FAULTED
The device or virtual device is completely inaccessible. This status typically indicates total failure of the device, such that ZFS is incapable of sending data to it or receiving data from it. If a top-level virtual device is in this state, then the pool is completely inaccessible.
OFFLINE
The device has been explicitly taken offline by the administrator.
REMOVED
The device was physically removed while the system was running. Device removal detection is hardware-dependent and might not be supported on all platforms.
The health of a pool is determined from the health of all its top-level virtual devices. If all virtual devices are ONLINE, then the pool is also ONLINE. If any one of the virtual devices is DEGRADED or UNAVAIL, then the pool is also DEGRADED. If a top-level virtual device is FAULTED or OFFLINE, then the pool is also FAULTED. A pool in the FAULTED state is completely inaccessible. No data can be recovered until the necessary devices are attached or repaired. A pool in the DEGRADED state continues to run, but you might not achieve the same level of data redundancy or data throughput than if the pool were online.
Basic Storage Pool Health Status
You can quickly review pool health status by using the zpool status command as follows:
# zpool status -x
all pools are healthy
Specific pools can be examined by specifying a pool name in the command syntax. Any pool that is not in the ONLINE state should be investigated for potential problems, as described in the next section.
Detailed Health Status
You can request a more detailed health summary status by using the -v option. For example:
# zpool status -v tank
  pool: tank
 state: DEGRADED
status: One or more devices could not be opened.  Sufficient replicas exist for
        the pool to continue functioning in a degraded state.
action: Attach the missing device and online it using 'zpool online'.
   see: http://www.sun.com/msg/ZFS-8000-2Q
 scrub: scrub completed after 0h0m with 0 errors on Wed Jan 20 15:13:59 2010
config:

        NAME        STATE     READ WRITE CKSUM
        tank        DEGRADED     0     0     0
          mirror-0  DEGRADED     0     0     0
            c1t0d0  ONLINE       0     0     0
            c1t1d0  UNAVAIL      0     0     0  cannot open

errors: No known data errors
This output displays a complete description of why the pool is in its current state, including a readable description of the problem and a link to a knowledge article for more information. Each knowledge article provides up-to-date information about the best way to recover from your current problem. Using the detailed configuration information, you can determine which device is damaged and how to repair the pool.
In the preceding example, the faulted device should be replaced. After the device is replaced, use the zpool online command to bring the device online. For example:
# zpool online tank c1t0d0
Bringing device c1t0d0 online
# zpool status -x
all pools are healthy
If the autoreplace property is on, you might not have to online the replaced device.
If a pool has an offline device, the command output identifies the problem pool. For example:
# zpool status -x
  pool: tank
 state: DEGRADED
status: One or more devices has been taken offline by the administrator.
        Sufficient replicas exist for the pool to continue functioning in a
        degraded state.
action: Online the device using 'zpool online' or replace the device with
        'zpool replace'.
 scrub: resilver completed after 0h0m with 0 errors on Wed Jan 20 15:15:09 2010
config:

        NAME        STATE     READ WRITE CKSUM
        tank        DEGRADED     0     0     0
          mirror-0  DEGRADED     0     0     0
            c1t0d0  ONLINE       0     0     0
            c1t1d0  OFFLINE      0     0     0  48K resilvered

errors: No known data errors
The READ and WRITE columns provide a count of I/O errors that occurred on the device, while the CKSUM column provides a count of uncorrectable checksum errors that occurred on the device. Both error counts indicate a potential device failure, and some corrective action is needed. If non-zero errors are reported for a top-level virtual device, portions of your data might have become inaccessible.
The errors: field identifies any known data errors.
In the preceding example output, the offline device is not causing data errors.
For more information about diagnosing and repairing faulted pools and data, see Chapter 11, Oracle Solaris ZFS Troubleshooting and Pool Recovery.
Original Article
Repairing Damaged Data
The following sections describe how to identify the type of data corruption and how to repair the data, if possible.
- Identifying the Type of Data Corruption
- Repairing a Corrupted File or Directory
- Repairing ZFS Storage Pool-Wide Damage
ZFS uses checksums, redundancy, and self-healing data to minimize the risk of data corruption. Nonetheless, data corruption can occur if a pool isn't redundant, if corruption occurred while a pool was degraded, or an unlikely series of events conspired to corrupt multiple copies of a piece of data. Regardless of the source, the result is the same: The data is corrupted and therefore no longer accessible. The action taken depends on the type of data being corrupted and its relative value. Two basic types of data can be corrupted:
-
Pool metadata – ZFS requires a certain amount of data to be parsed to open a pool and access datasets. If this data is corrupted, the entire pool or portions of the dataset hierarchy will become unavailable.
-
Object data – In this case, the corruption is within a specific file or directory. This problem might result in a portion of the file or directory being inaccessible, or this problem might cause the object to be broken altogether.
Data is verified during normal operations as well as through a scrubbing. For information about how to verify the integrity of pool data, see Checking ZFS File System Integrity.
Identifying the Type of Data Corruption
By default, the zpool status command shows only that corruption has occurred, but not where this corruption occurred. For example:
# zpool status monkey
  pool: monkey
 state: ONLINE
status: One or more devices has experienced an error resulting in data
        corruption.  Applications may be affected.
action: Restore the file in question if possible.  Otherwise restore the
        entire pool from backup.
   see: http://www.sun.com/msg/ZFS-8000-8A
 scrub: scrub completed after 0h0m with 8 errors on Tue Jul 13 13:17:32 2010
config:

        NAME        STATE     READ WRITE CKSUM
        monkey      ONLINE       8     0     0
          c1t1d0    ONLINE       2     0     0
          c2t5d0    ONLINE       6     0     0

errors: 8 data errors, use '-v' for a list
Each error indicates only that an error occurred at a given point in time. Each error is not necessarily still present on the system. Under normal circumstances, this is the case. Certain temporary outages might result in data corruption that is automatically repaired after the outage ends. A complete scrub of the pool is guaranteed to examine every active block in the pool, so the error log is reset whenever a scrub finishes. If you determine that the errors are no longer present, and you don't want to wait for a scrub to complete, reset all errors in the pool by using the zpool online command.
If the data corruption is in pool-wide metadata, the output is slightly different. For example:
# zpool status -v morpheus
  pool: morpheus
    id: 1422736890544688191
 state: FAULTED
status: The pool metadata is corrupted.
action: The pool cannot be imported due to damaged devices or data.
   see: http://www.sun.com/msg/ZFS-8000-72
config:

        morpheus    FAULTED   corrupted data
          c1t10d0   ONLINE
In the case of pool-wide corruption, the pool is placed into the FAULTED state because the pool cannot provide the required redundancy level.
Repairing a Corrupted File or Directory
If a file or directory is corrupted, the system might still function, depending on the type of corruption. Any damage is effectively unrecoverable if no good copies of the data exist on the system. If the data is valuable, you must restore the affected data from backup. Even so, you might be able to recover from this corruption without restoring the entire pool.
If the damage is within a file data block, then the file can be safely removed, thereby clearing the error from the system. Use the zpool status -v command to display a list of file names with persistent errors. For example:
# zpool status -v
  pool: monkey
 state: ONLINE
status: One or more devices has experienced an error resulting in data
        corruption.  Applications may be affected.
action: Restore the file in question if possible.  Otherwise restore the
        entire pool from backup.
   see: http://www.sun.com/msg/ZFS-8000-8A
 scrub: scrub completed after 0h0m with 8 errors on Tue Jul 13 13:17:32 2010
config:

        NAME        STATE     READ WRITE CKSUM
        monkey      ONLINE       8     0     0
          c1t1d0    ONLINE       2     0     0
          c2t5d0    ONLINE       6     0     0

errors: Permanent errors have been detected in the following files:

/monkey/a.txt
/monkey/bananas/b.txt
/monkey/sub/dir/d.txt
monkey/ghost/e.txt
/monkey/ghost/boo/f.txt
The list of file names with persistent errors might be described as follows:
- If the full path to the file is found and the dataset is mounted, the full path to the file is displayed. For example:
/monkey/a.txt- If the full path to the file is found, but the dataset is not mounted, then the dataset name with no preceding slash (/), followed by the path within the dataset to the file, is displayed. For example:
monkey/ghost/e.txt- If the object number to a file path cannot be successfully translated, either due to an error or because the object doesn't have a real file path associated with it, as is the case for a dnode_t, then the dataset name followed by the object's number is displayed. For example:
monkey/dnode:<0x0>- If an object in the metaobject set (MOS) is corrupted, then a special tag of
<metadata>, followed by the object number, is displayed.
If the corruption is within a directory or a file's metadata, the only choice is to move the file elsewhere. You can safely move any file or directory to a less convenient location, allowing the original object to be restored in its place.
Repairing ZFS Storage Pool-Wide Damage
If the damage is in pool metadata and that damage prevents the pool from being opened or imported, then the following options are available:
- Attempt to recover the pool by using the
zpool clear -Fcommand or thezpool import -Fcommand. These commands attempt to roll back the last few pool transactions to an operational state. You can use thezpool statuscommand to review a damaged pool and the recommended recovery steps. For example:
# zpool status
  pool: tpool
 state: FAULTED
status: The pool metadata is corrupted and the pool cannot be opened.
action: Recovery is possible, but will result in some data loss.
        Returning the pool to its state as of Wed Jul 14 11:44:10 2010
        should correct the problem.  Approximately 5 seconds of data
        must be discarded, irreversibly.  Recovery can be attempted
        by executing 'zpool clear -F tpool'.  A scrub of the pool
        is strongly recommended after recovery.
   see: http://www.sun.com/msg/ZFS-8000-72
 scrub: none requested
config:

        NAME        STATE     READ WRITE CKSUM
         tpool      FAULTED      0     0     1  corrupted data
          c1t1d0    ONLINE       0     0     2
          c1t3d0    ONLINE       0     0     4
The recovery process as described above is to use the following command:
# zpool clear -F tpoolIf you attempt to import a damaged storage pool, you will see messages similar to the following:
# zpool import tpool
cannot import 'tpool': I/O error
        Recovery is possible, but will result in some data loss.
        Returning the pool to its state as of Wed Jul 14 11:44:10 2010
        should correct the problem.  Approximately 5 seconds of data
        must be discarded, irreversibly.  Recovery can be attempted
        by executing 'zpool import -F tpool'.  A scrub of the pool
        is strongly recommended after recovery.
The recovery process as described above is to use the following command:
# zpool import -F tpool
Pool tpool returned to its state as of Wed Jul 14 11:44:10 2010.
Discarded approximately 5 seconds of transactions
If the damaged pool is in the zpool.cache file, the problem is discovered when the system is booted, and the damaged pool is reported in the zpool status command. If the pool isn't in the zpool.cache file, it won't successfully import or open and you'll see the damaged pool messages when you attempt to import the pool.
If the pool cannot be recovered by the pool recovery method described above, you must restore the pool and all its data from a backup copy. The mechanism you use varies widely depending on the pool configuration and backup strategy. First, save the configuration as displayed by the zpool status command so that you can recreate it after the pool is destroyed. Then, use the zpool destroy -f command to destroy the pool. Also, keep a file describing the layout of the datasets and the various locally set properties somewhere safe, as this information will become inaccessible if the pool is ever rendered inaccessible. With the pool configuration and dataset layout, you can reconstruct your complete configuration after destroying the pool. The data can then be populated by using whatever backup or restoration strategy you use.
Repairing a Corrupted File or Directory
If a file or directory is corrupted, the system might still function, depending on the type of corruption. Any damage is effectively unrecoverable if no good copies of the data exist on the system. If the data is valuable, you must restore the affected data from backup. Even so, you might be able to recover from this corruption without restoring the entire pool.
If the damage is within a file data block, then the file can be safely removed, thereby clearing the error from the system. Use the zpool status –v command to display a list of file names with persistent errors. For example:
# zpool status tank -v
pool: tank
state: ONLINE
status: One or more devices has experienced an error resulting in data
corruption.  Applications may be affected.
action: Restore the file in question if possible. Otherwise restore the
entire pool from backup.
see: http://support.oracle.com/msg/ZFS-8000-8A
config:

NAME                     STATE     READ WRITE CKSUM
tank                     ONLINE       4     0     0
c0t5000C500335E106Bd0    ONLINE       0     0     0
c0t5000C500335FC3E7d0    ONLINE       4     0     0

errors: Permanent errors have been detected in the following files:
/tank/file.1
/tank/file.2
The list of file names with persistent errors might be described as follows:
- If the full path to the file is found and the dataset is mounted, the full path to the file is displayed. For example:
/monkey/a.txt- If the full path to the file is found, but the dataset is not mounted, then the dataset name with no preceding slash (/), followed by the path within the dataset to the file, is displayed. For example:
monkey/ghost/e.txt- If the object number to a file path cannot be successfully translated, either due to an error or because the object doesn't have a real file path associated with it, as is the case for a
dnode_t, then the dataset name followed by the object's number is displayed. For example:
monkey/dnode:<0x0>- If an object in the metaobject set (MOS) is corrupted, then a special tag of
<metadata>, followed by the object number, is displayed.
You can attempt to resolve more minor data corruption by using scrubbing the pool and clearing the pool errors in multiple iterations. If the first scrub and clear iteration does not resolve the corrupted files, run them again.For example:
# zpool scrub tank
# zpool clear tank
If the corruption is within a directory or a file's metadata, the only choice is to move the file elsewhere. You can safely move any file or directory to a less convenient location, allowing the original object to be restored in its place.
Repairing Corrupted Data With Multiple Block References
If a damaged file system has corrupted data with multiple block references, such as snapshots, the zpool status –v command cannot display all corrupted data paths. The current zpool status reporting of corrupted data is limited by the amount of metadata corruption and if any blocks have been reused after the zpool status command is executed. Deduplicated blocks makes reporting all corrupted data even more complicated.
If you have corrupted data and the zpool status –v command identifies that snapshot data is impacted, then considering running the following command to identify additional corrupted paths:
Using smartctl to get SMART status information on your hard drives
Computer hard drives today come with SMART (Self-Monitoring, Analysis, and Reporting Technology) built-in, which allows you to see the status or overall “health” of a hard drive. This information is invaluable in providing early warning signs of problems with a hard drive.
All Linux distributions provide the smartmontools package, which contain the smartctl program used to display SMART information from attached drives. This package also provides the smartd daemon which periodically polls the drives to obtain SMART information.
Using smartd is essential as it can let you know immediately when a SMART attribute fails. To begin, edit /etc/smartd.conf and add entries for your drives:
/dev/sda -d ata -H -m root
/dev/sdb -d ata -H -m root
The above tells smartd to perform a very silent check and to email the root user if the overall SMART health status fails. It also tells smartd that these are ATA devices. There are a number of other options that can be added as well; the smartd.conf file has examples of these.
When smartd is configured, make sure to enable the monitoring daemon if it is not already started. On a Red Hat Enterprise Linux system, use:
# chkconfig smartd on
# service smartd start
The smartctl program also allows for you to view and test SMART attributes of a drive. You can quickly check the overall health of a drive by using:
# smartctl -H /dev/sda
smartctl version 5.38 [x86_64-redhat-linux-gnu] Copyright (C) 2002-8 Bruce Allen
Home page is http://smartmontools.sourceforge.net/
=== START OF READ SMART DATA SECTION ===
SMART overall-health self-assessment test result: PASSED
Obtaining information on the drive is useful as well. With the -i option, you can view the type of drive, its serial number, and so forth. In a system with a lot of drives, having this information recorded can assist in knowing which drive device (i.e., /dev/sda) corresponds with which physical drive. For instance:
# smartctl -i /dev/sda
smartctl version 5.38 [x86_64-redhat-linux-gnu] Copyright (C) 2002-8 Bruce Allen
Home page is http://smartmontools.sourceforge.net/
=== START OF INFORMATION SECTION ===
Model Family:     Seagate Barracuda 7200.10 family
Device Model:     ST3320620AS
Serial Number:    9QF26NGD
Firmware Version: 3.AAJ
User Capacity:    320,072,933,376 bytes
Device is:        In smartctl database [for details use: -P show]
ATA Version is:   7
ATA Standard is:  Exact ATA specification draft version not indicated
Local Time is:    Sun Mar  7 14:20:18 2010 MST
SMART support is: Available - device has SMART capability.
SMART support is: Enabled
Next, the -a option shows the specifics of the SMART attributes and test history. This shows various SMART status information, such as the drive temperature, how many hours it has been powered on, and so forth. It also indicates when tests have been performed and what the results of those tests were.
Finally, smartctl can be used to initiate long and short tests for the drive. These should be run periodically to do quick, or full, self-tests of the drive:
# smartctl --test=short /dev/sda
# smartctl --test=long /dev/sda
# smartctl -a /dev/sda
The above will first perform a short test of the /dev/sda device. This usually takes about a minute to perform, and the smartctl output will tell you when you can check the results. Next, the long test: this one can take quite a bit longer (about two hours here on a 320GB SATA drive). Finally, use the -a option to view the results, which may look like this:
SMART Self-test log structure revision number 1
Num  Test_Description    Status                  Remaining  LifeTime(hours)  LBA_of_first_error
# 1  Short offline       Completed without error       00%     17877         -
# 2  Extended offline    Completed without error       00%      8449         -
# 3  Short offline       Completed without error       00%      8446         -
# 4  Short offline       Completed without error       00%      1307         -
# 5  Short offline       Completed without error       00%         2         -
# 6  Extended offline    Self-test routine in progress 90%     17877         -
In the above example, tests have been run over the lifetime of the drive and the short offline test was recently completed without error, while there is still 90% of the extended test remaining.
Being pro-active with the health of your hard drives can pay off huge by being aware of most problems before they can lead to catastrophic failures. While SMART monitoring is not an exact thing (it won’t always report failures before they occur), the chances of catching a problem and being able to retrieve data before replacing a drive are more likely to not result in data loss or other problems than if you did not use it.
Get the PDF version of this tip here.